carolinlawson2.github.io
Streamlit and Pygwalker: A Dynamic Duo for Data Exploration and Visualization
Unleash the power of Streamlit and Pygwalker in your data analysis journey as we dive into the world of interactive data visualization and exploration. With these two incredible Python libraries at your disposal, you can transform your data scripts into captivating web applications without breaking a sweat. Say goodbye to the complexities of web development and coding challenges, and say hello to a seamless and user-friendly data exploration experience.
What makes Streamlit special?
Streamlit is a game-changer when it comes to simplifying the process of creating interactive web applications from your data scripts. With Streamlit, you don’t have to worry about the intricacies of web development or coding complexities. It is a fast, open-source, and free solution for building and sharing data applications. Streamlit lets you focus on what matters most - analyzing and visualizing your data.
Enter Pygwalker, the visualization expert
Pygwalker is designed specifically for data analysis and visualization. It provides an intuitive interface that allows data scientists and analysts to generate stunning visualizations without the need for coding skills. With Pygwalker, you can easily create scatter plots, line plots, bar charts, histograms, and more. It’s a powerhouse of visualization capabilities at your fingertips.
To learn more about Pygwalker and access additional examples and resources, visit the official Pygwalker GitHub Page.
Getting Started: Setting Up Streamlit and Pygwalker
Before we embark on our exciting data exploration journey, let’s make sure your computer is ready to roll. You’ll need a Python environment (preferably version 3.6 or higher) to get started. If you already have that, follow these simple steps:
Step 1: Installing the Dependencies
Using your command prompt or terminal, install the necessary dependencies by executing the following commands:
pip install pandas
pip install pygwalker
pip install streamlit
Step 2: Incorporating Pygwalker in a Streamlit Application
Now, create a new Python script called pygwalker_demo.py with your favorite code editor and add the following code:
import pygwalker as pyg
import pandas as pd
import streamlit.components.v1 as components
import streamlit as st

# Configure the Streamlit page
st.set_page_config(
    page_title="Using Pygwalker with Streamlit",
    layout="wide"
)

# Add a catchy title to your Streamlit app
st.title("Using Pygwalker with Streamlit")

# Import your data
df = pd.read_csv("https://sample.csv")

# Use Pygwalker to generate the HTML for visualization
pyg_html = pyg.walk(df, return_html=True)

# Embed the generated HTML into your Streamlit app
components.html(pyg_html, height=1000, scrolling=True)
Step 3: Let the Data Exploration Begin
It’s showtime! Run the following command in your command prompt or terminal to launch the Streamlit application and start exploring your data:
streamlit run pygwalker_demo.py
You’ll see some information displayed on the terminal. Access your Streamlit app in the web browser using the provided URL:
Local URL: http://localhost:8501
Network URL: http://xxx.xxx.xxx.xxx:8501
Open the provided URL (http://localhost:8501) in your web browser and witness the magic of Pygwalker’s interactive data exploration and visualization capabilities through Streamlit.
Saving the State of a Pygwalker Chart
If you want to save the state of a Pygwalker chart, follow these simple steps:
- Click the export button on the chart.
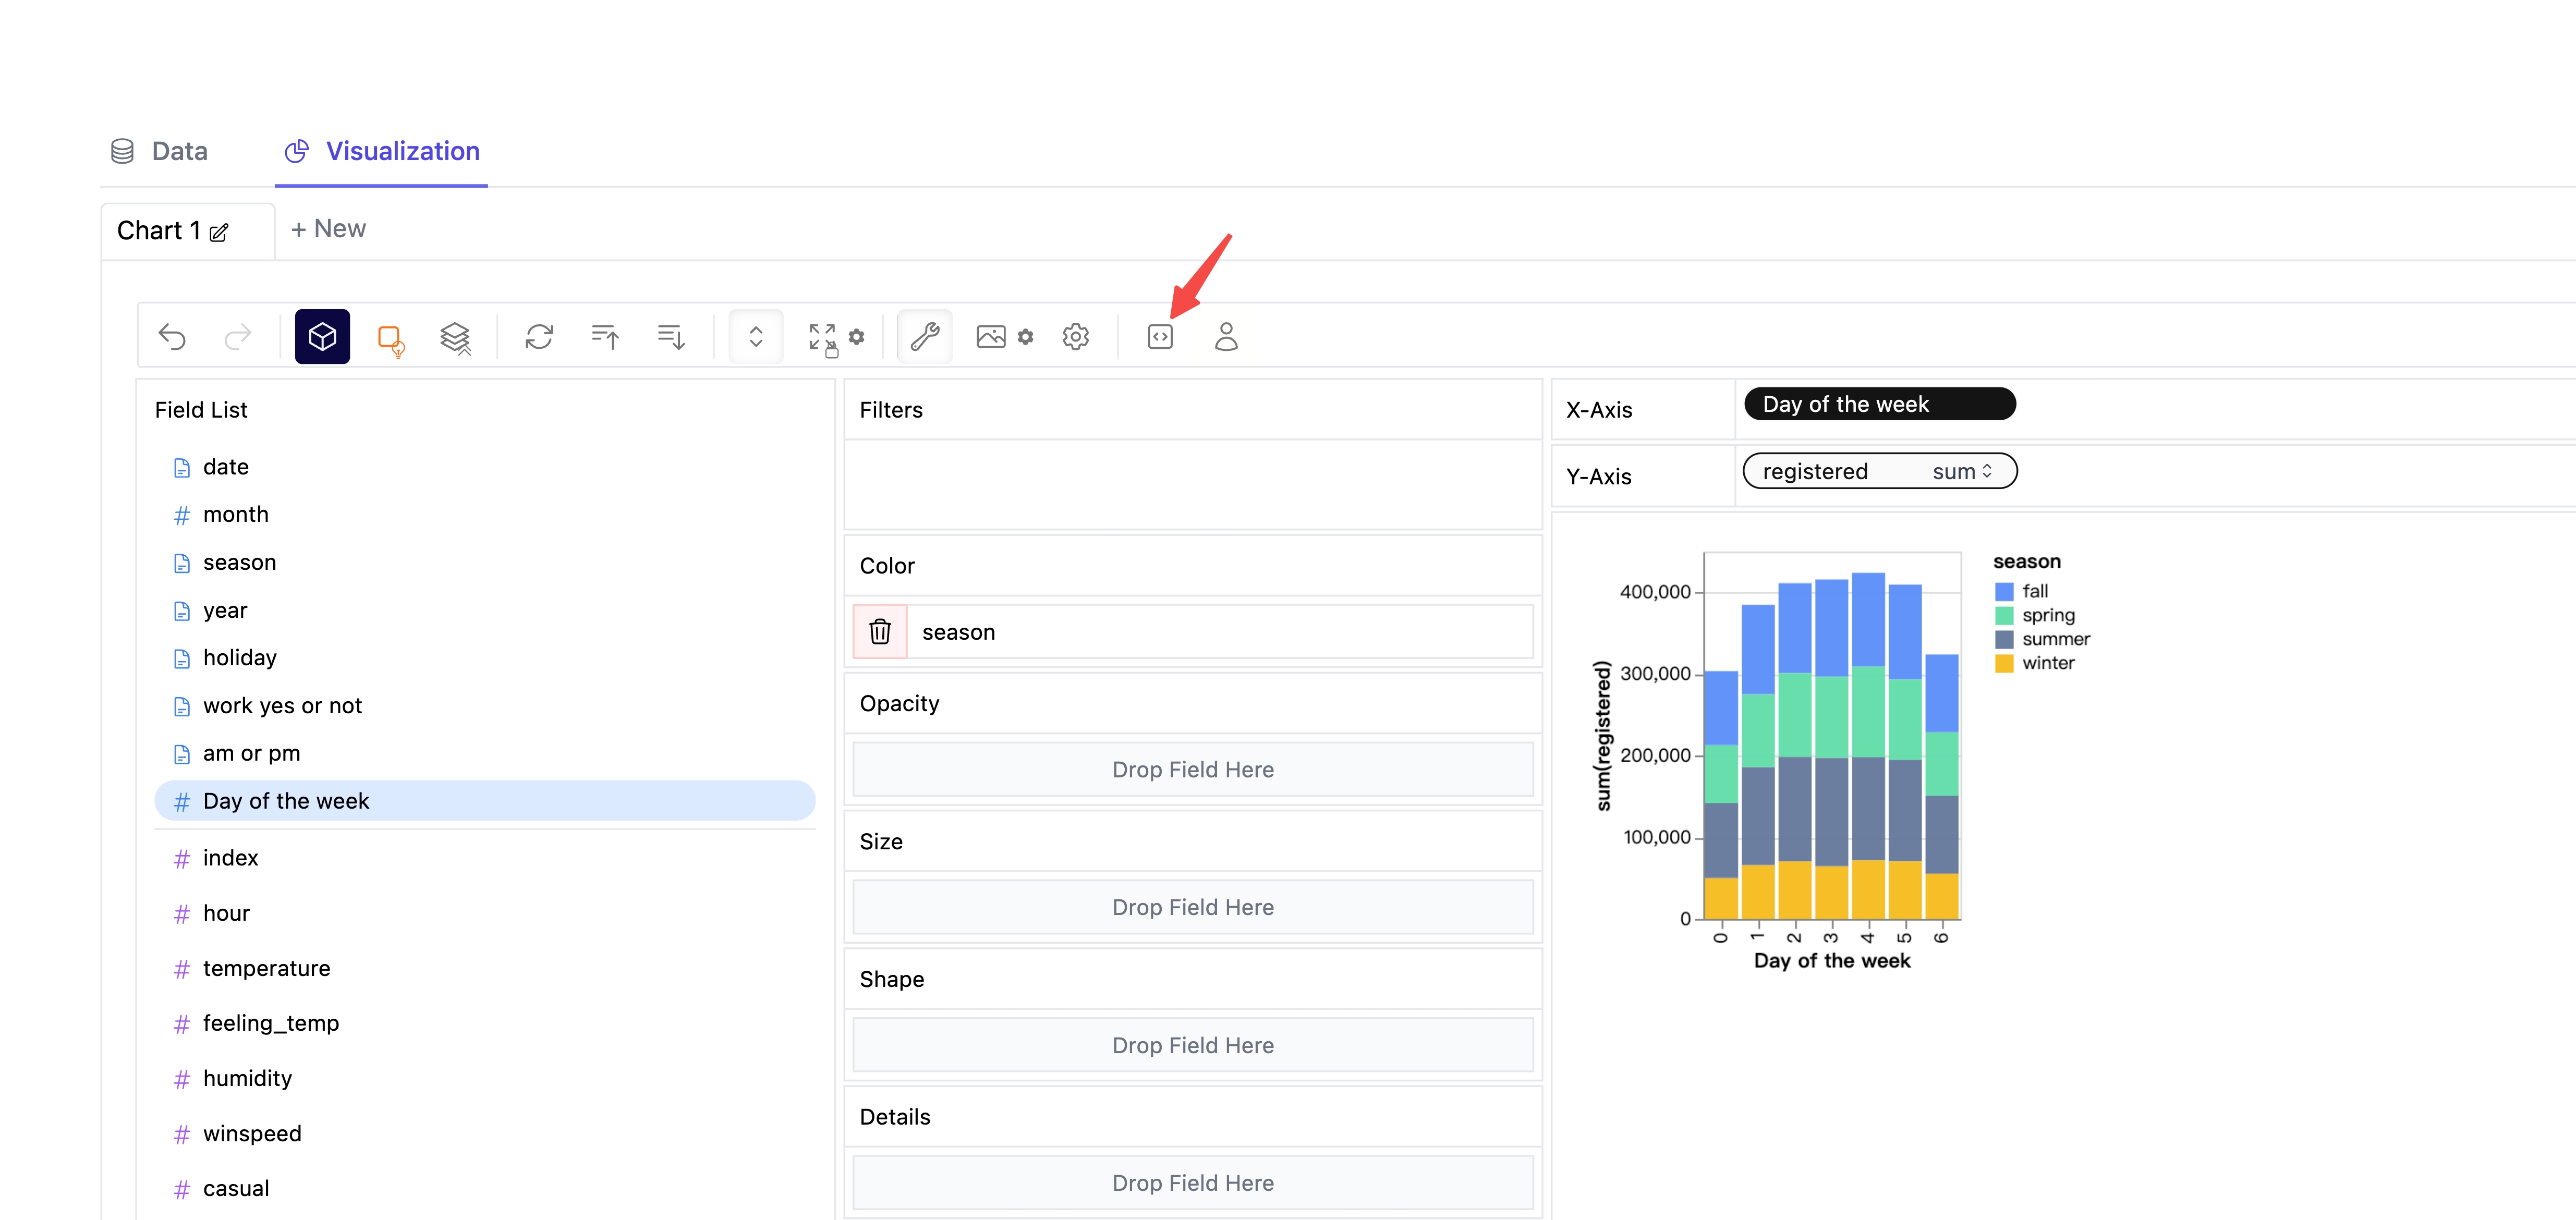
- Click the copy code button.
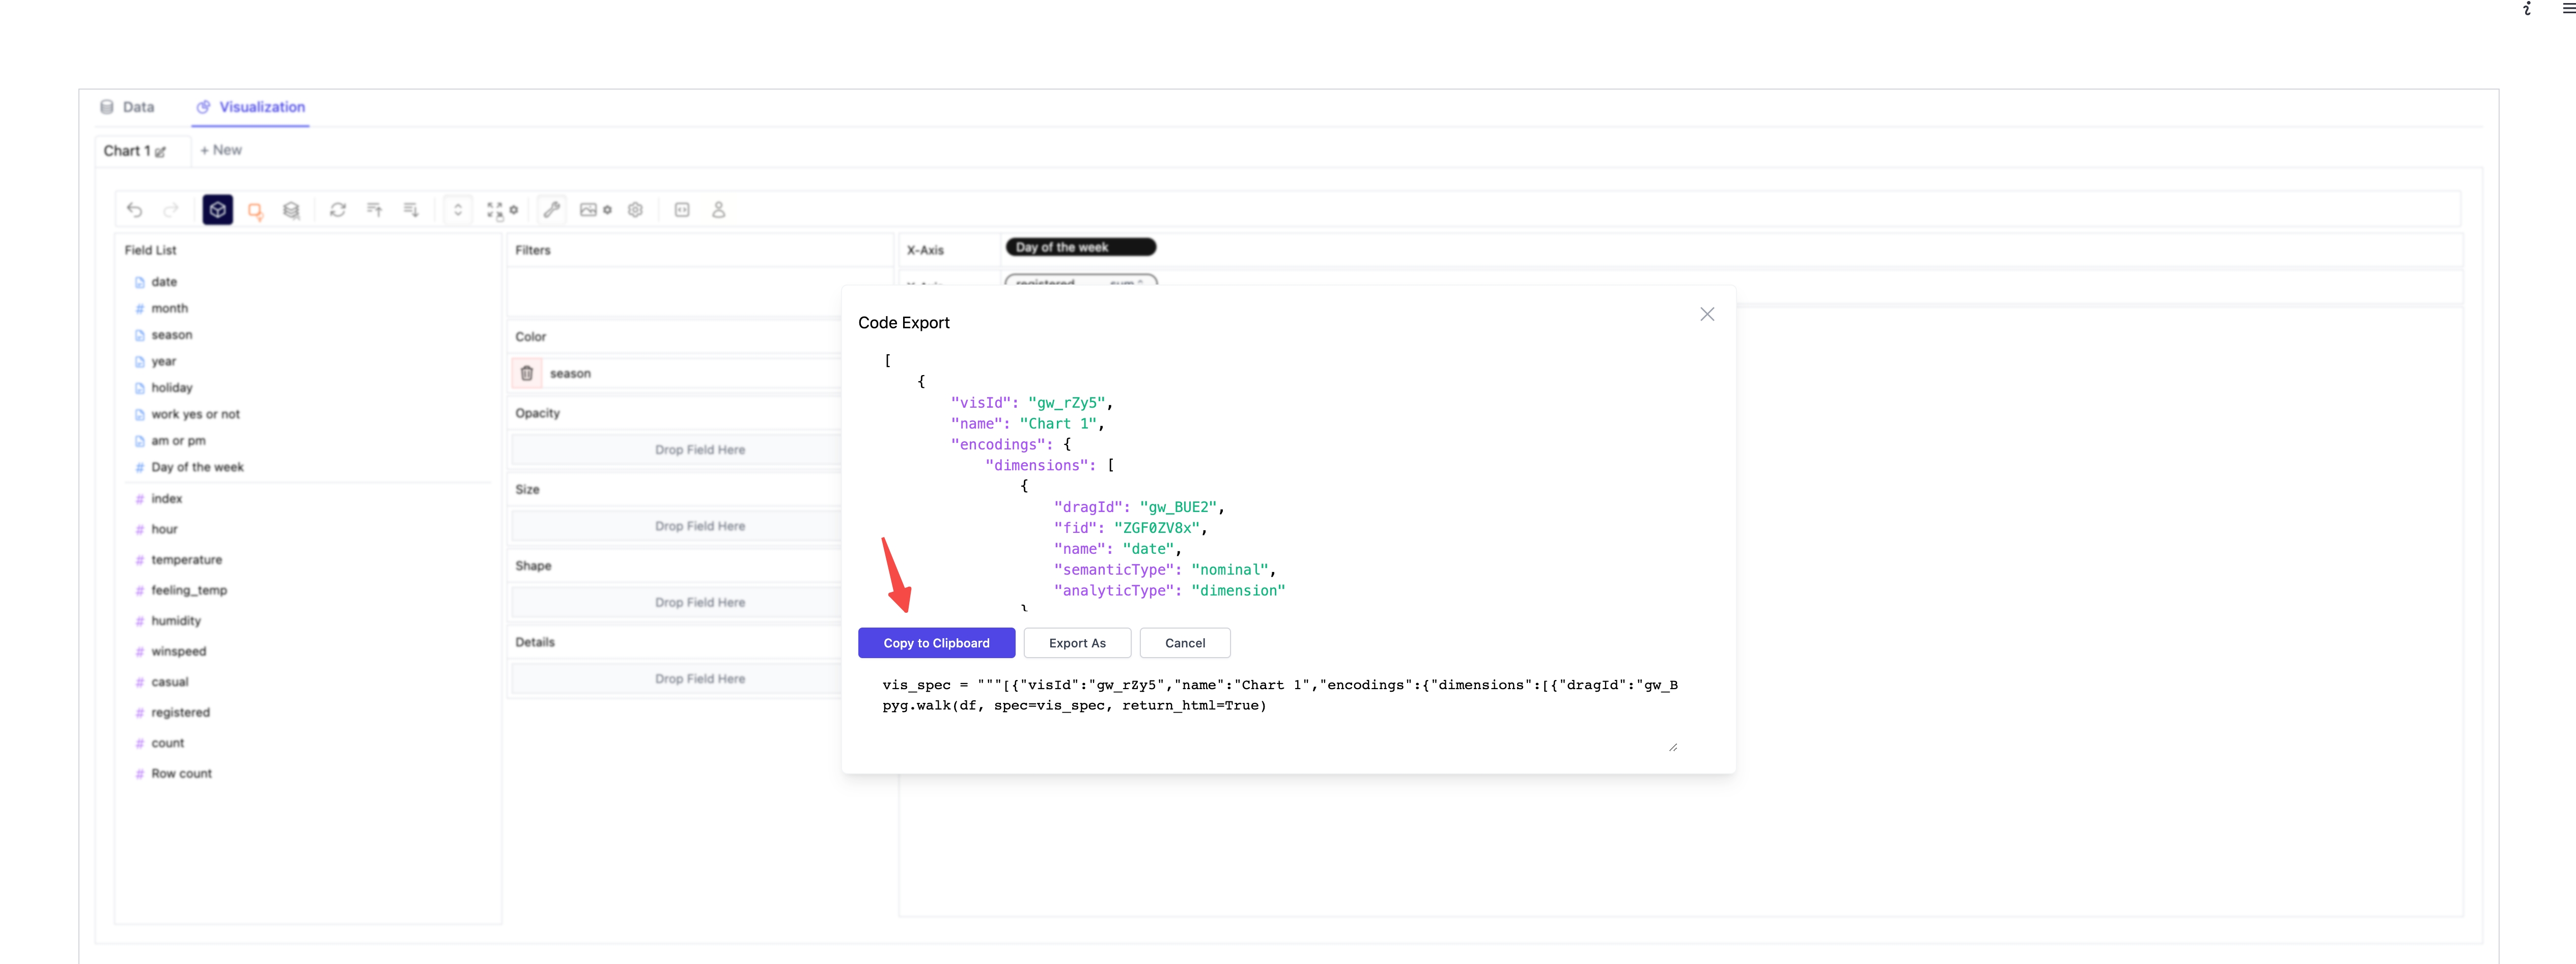
- Paste the copied code into your Python script where needed.
import pygwalker as pyg
import pandas as pd
import streamlit.components.v1 as components
import streamlit as st

# Configure the Streamlit page
st.set_page_config(
    page_title="Using Pygwalker with Streamlit",
    layout="wide"
)

# Add a catchy title to your Streamlit app
st.title("Using Pygwalker with Streamlit")

# Import your data
df = pd.read_csv("https://kanaries-app.s3.ap-northeast-1.amazonaws.com/public-datasets/bike_sharing_dc.csv")

# Paste the copied Pygwalker chart code here
vis_spec = """<PASTE_COPIED_CODE_HERE>"""

# Use Pygwalker to generate the HTML for visualization
pyg_html = pyg.walk(df, spec=vis_spec, return_html=True)

# Embed the generated HTML into your Streamlit app
components.html(pyg_html, height=1000, scrolling=True)
Remember to refresh the webpage to see the saved state of your Pygwalker chart.
It’s worth noting that Pygwalker is built upon graphic-walker, a powerful library that can be embedded in various platforms, such as Excel and Airtable. This means that your Pygwalker app can seamlessly collaborate with users in different environments, leveraging the capabilities of graphic-walker and Pygwalker.
Conclusion: Empower Your Data Exploration with Streamlit and Pygwalker
Streamlit and Pygwalker are a dream team when it comes to simplifying data exploration and visualization. Streamlit provides a user-friendly interface, while Pygwalker offers interactive visualization options, unlocking new possibilities for your data analysis workflow. Dive into your data, explore insights, and share your discoveries effortlessly with the world using Streamlit and Pygwalker.
References
For more detailed information on using Streamlit with Pygwalker, refer to the official documentation.